Magna Park North Unit 3, Lutterworth
Sustainability
Emissions Reduction Case Study
TSL was contracted to deliver the shell and core of three identical commercial units with integrated offices in Magna Park Lutterworth with a total of 1,000,000 square foot of internal space. Construction activity included groundworks on a greenfield site and then construction of foundations, steel frame and composite cladding. This case study focuses on one of the three units, Magna Park North 3a.
Working closely with all project parties, TSL was able to identify a series of changes to the baseline design that would deliver significant reduction in emissions. These changes are communicated in the table below using real world data at the end of the project.
| TSL REDUCTION MEASURE | EMISSIONS SAVING (kgCO2e) | REDUCTION ON BASELINE (%) |
|---|---|---|
| GGBS in Concrete Mixtures | 1,063,296 | 7.5 |
| Steel Cladding instead of Aluminium Cladding | 544,160 | 3.8 |
| Pad Foundations instead of Piled Foundations | 773,423 | 5.5 |
| Cut and Fill Retention | 1,443,235 | 10.2 |
| Reduction in Foundation Volume and External Yard Slab Thickness | 52,881 | 0.4 |
| Thinner Cladding Panels On Gatehouse | 441 | 0.0 |
| TOTAL | 3,877,436 kgCO2e | 27.4% |
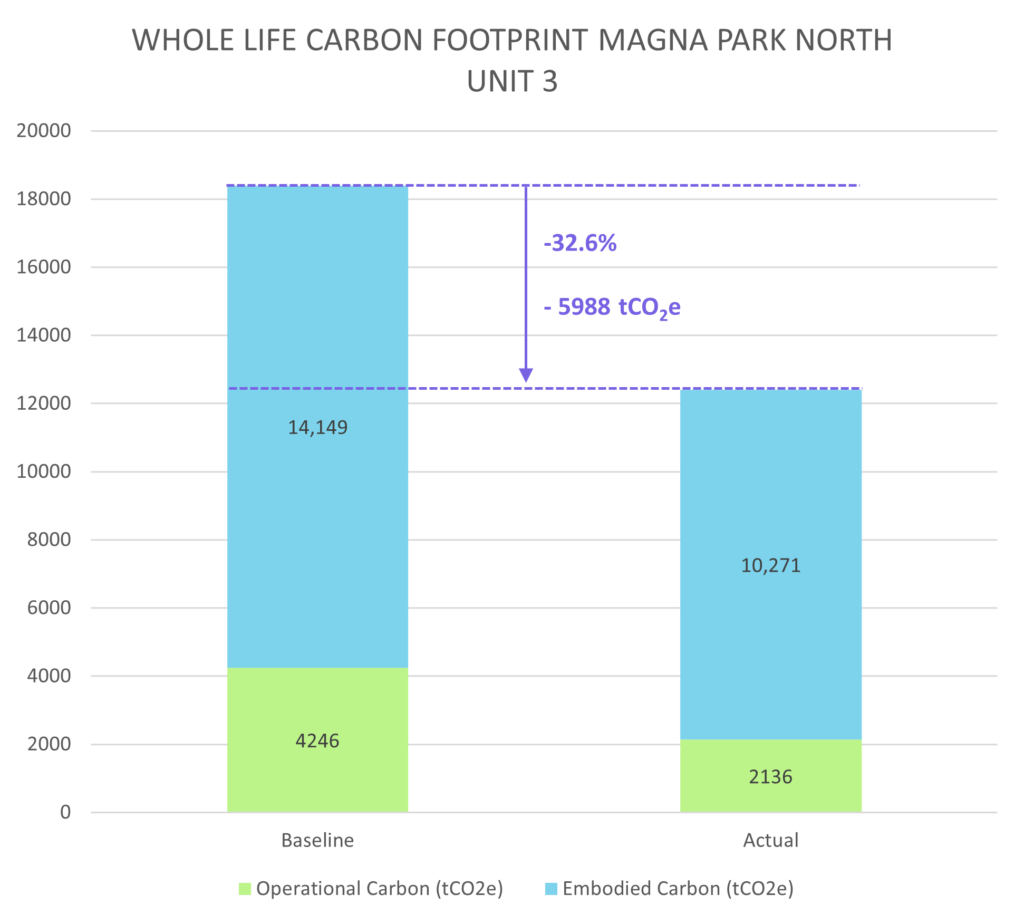
The embodied carbon of MPN3 was compared with its operational carbon. The latter arises from building heating and electricity demands. Operational carbon is compared using the emission figures taken from the Building Regulations UK Part L (BRUKL) certificate, which all non-domestic new builds require.
A 49% reduction in operational emissions was achieved. MPN3 was estimated to have an operational carbon of 2,136 tCO2e over 30 years (building regulations energy only). This includes grid decarbonisation. Without grid decarbonisation, the estimate was 4,237 tCO2e over 30 years. Reduction actions included LED lighting with selected circuits on motion sensor, a solar hot water thermal system, a hybrid air source heat pumps and photovoltaic panels.
The total whole life carbon saving was estimated to be 5,988 tonnes CO2e, over a 30-year period.
The embodied carbon saving was 3,877 tonnes CO2e and operational carbon 2,110 tonnes CO2e. The operational carbon emissions assumed grid decarbonisation, from the electricity in the national grid becoming cleaner over time. The reduction is shown visually in this chart.

Load More